Real outcomes, measurable impact
See how we've helped businesses unlock the power of their data.
All figures are approximate and based on specific client engagements. Individual results may vary. Some details have been anonymised. See our Disclaimer.
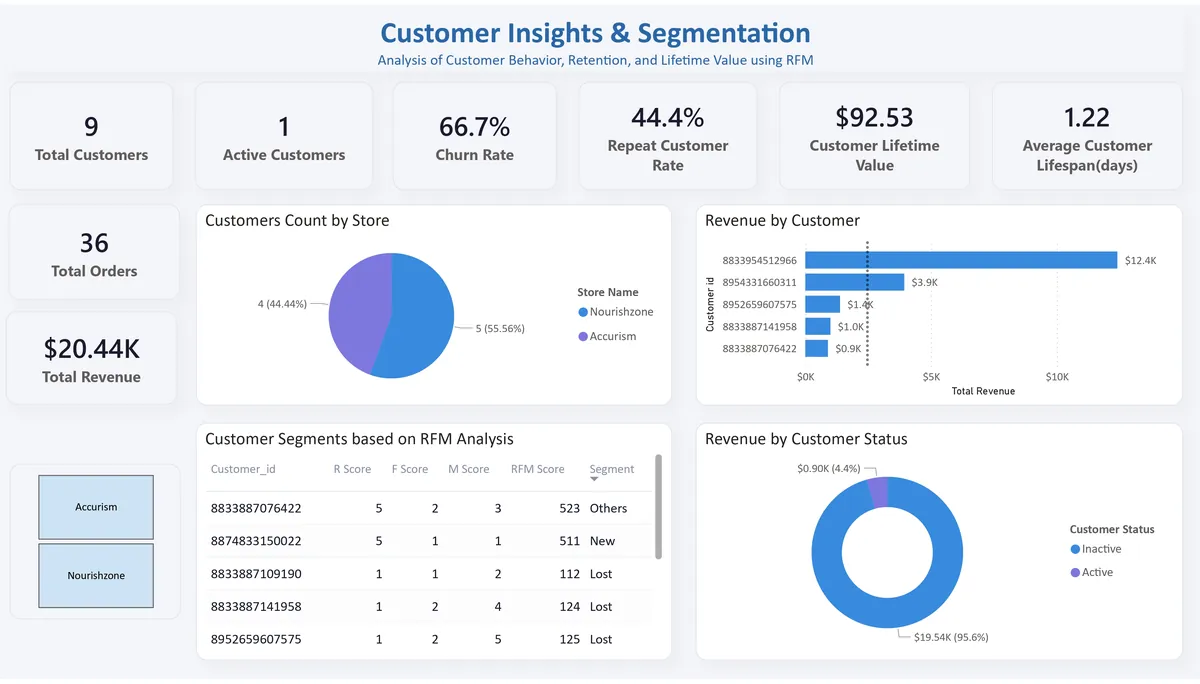
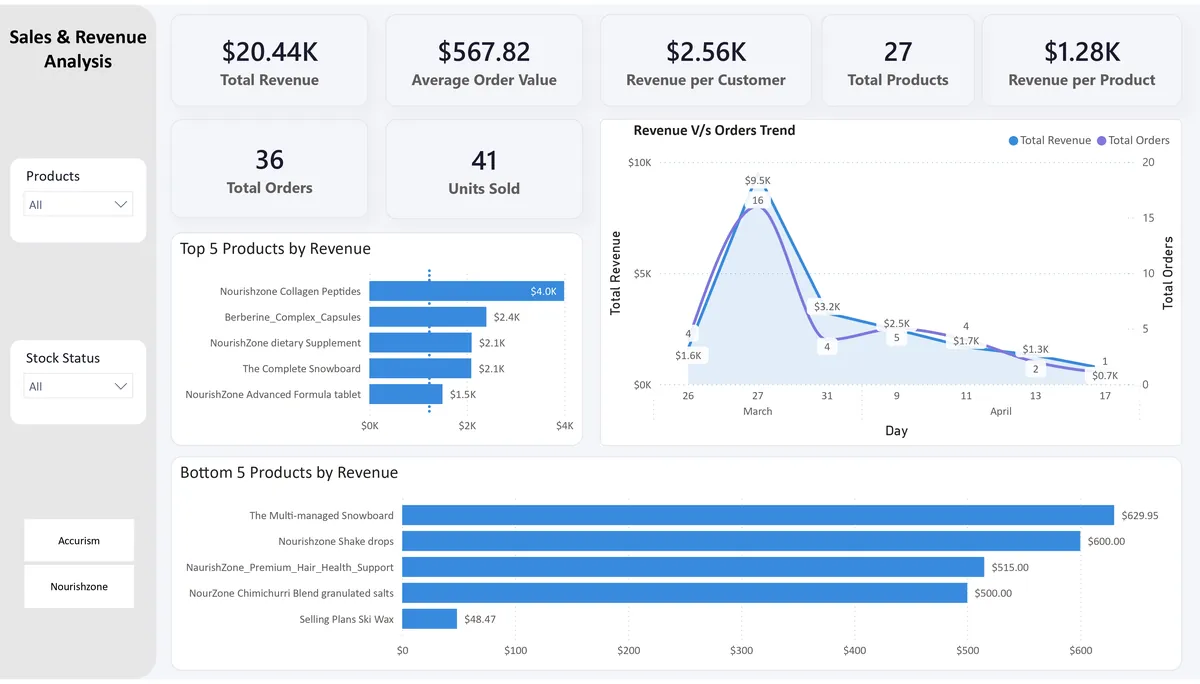
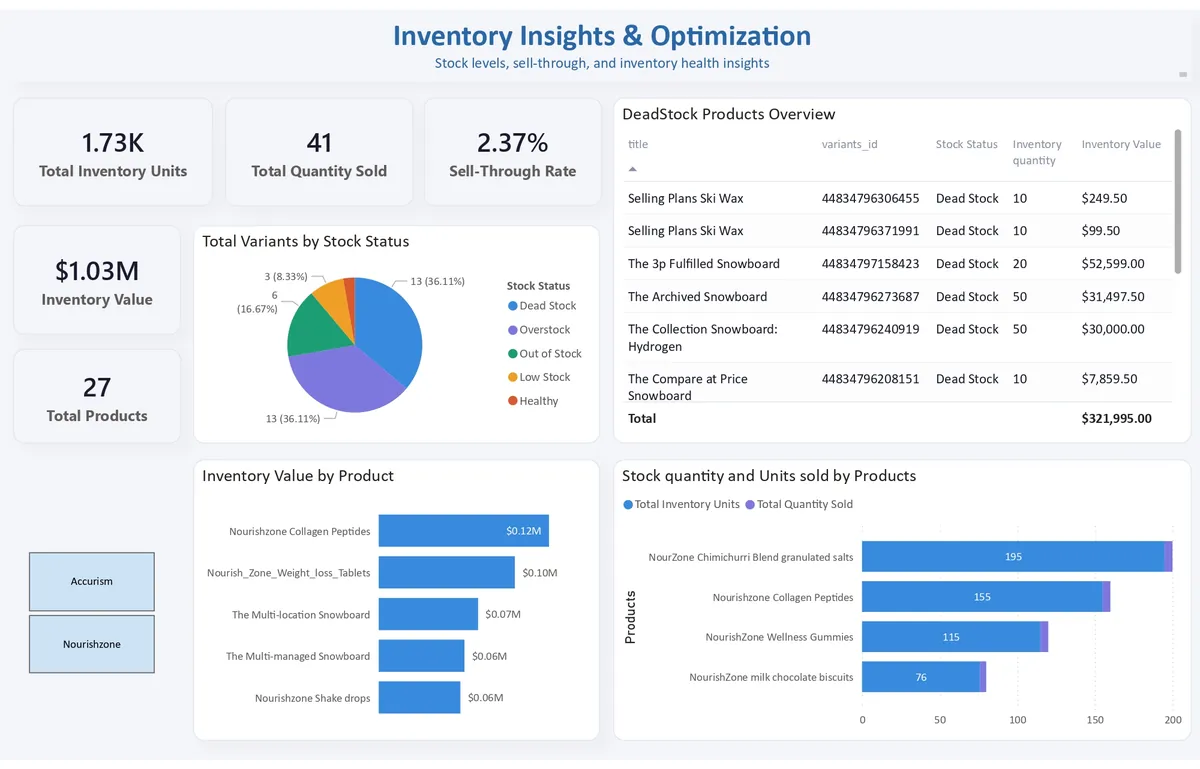
Shopify Dashboard
The Challenge: A growing Shopify merchant had no visibility beyond basic store reports. Marketing spend was untracked, product margins were unclear, and customer retention was a black box.
Our Approach: We connected the Shopify API, ad platforms, and shipping data into a unified Power BI analytics layer. Dashboards covered sales performance, product margins, customer lifetime value, and inventory turnover.
The Outcome: The team gained real-time visibility into what's selling, what's profitable, and where to invest. Marketing ROI improved 42% within the first quarter.
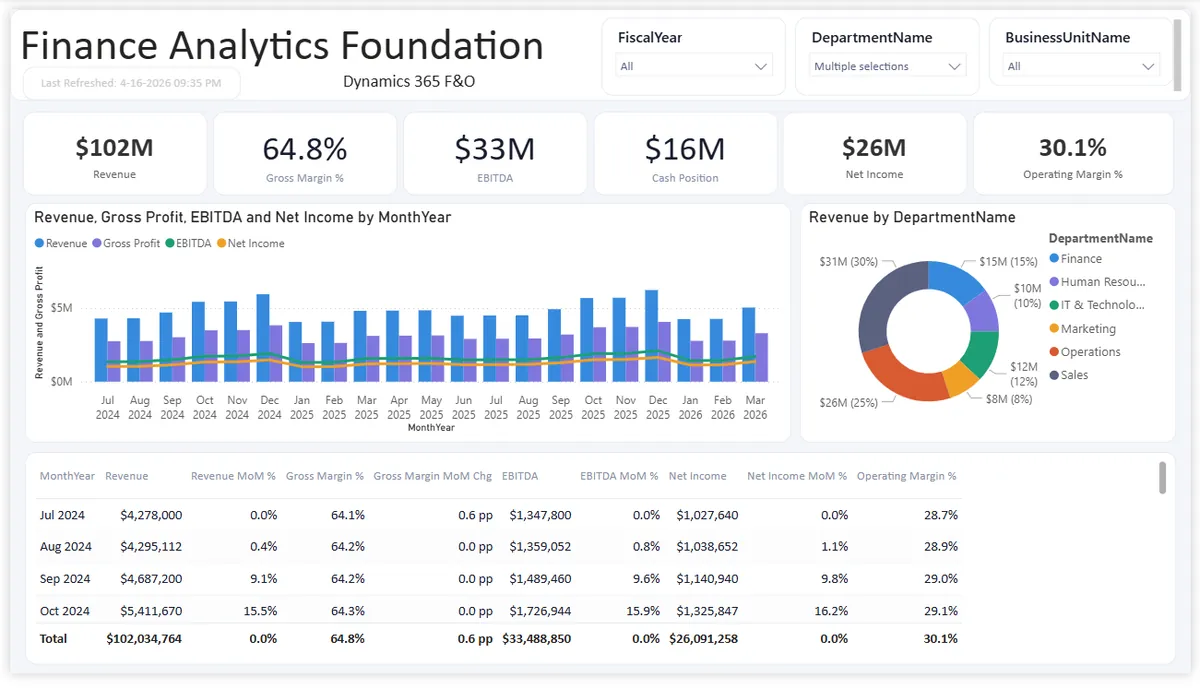
Finance Analytics Foundation for Dynamics 365 Finance & Operations
The Challenge: A mid-market enterprise running Dynamics 365 Finance & Operations had no structured reporting layer. Finance teams relied on exported spreadsheets, with board packs taking 5+ days to prepare.
Our Approach: We built a structured Power BI finance reporting layer directly on top of Dynamics 365 F&O, covering P&L, Balance Sheet, Cash Flow, and departmental cost analysis with full drill-through capability.
The Outcome: Monthly reporting is now automated end-to-end. Board packs take hours instead of days. The CFO presents with confidence knowing every number is traceable and reconciled.
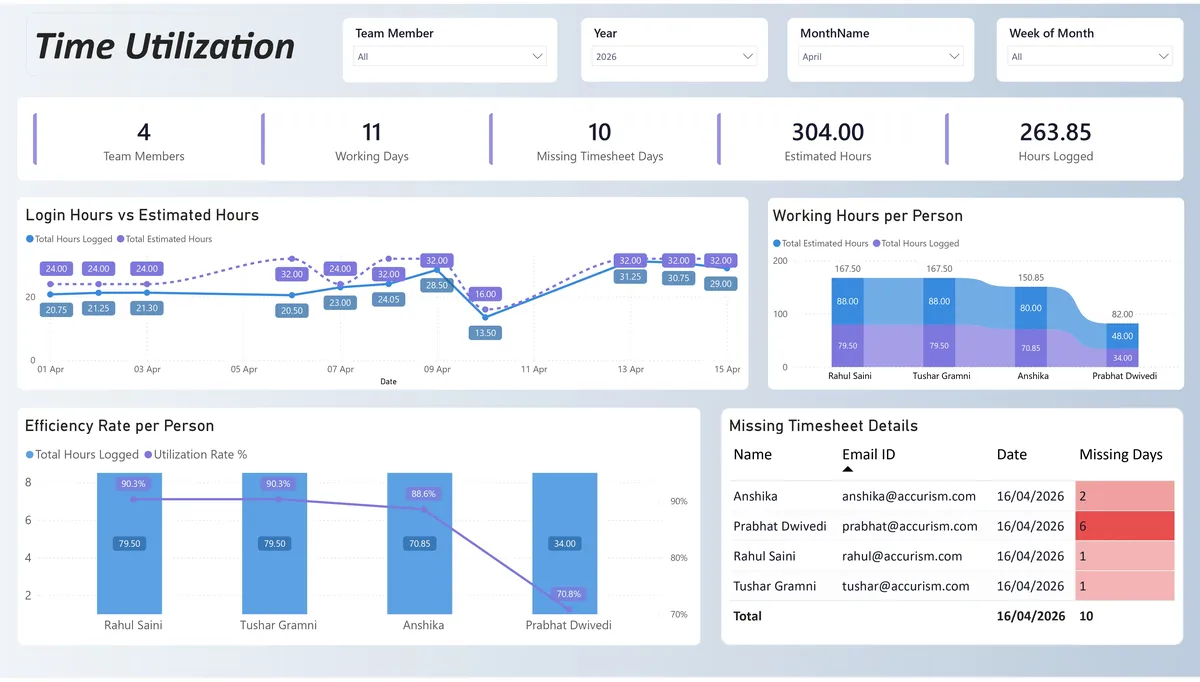
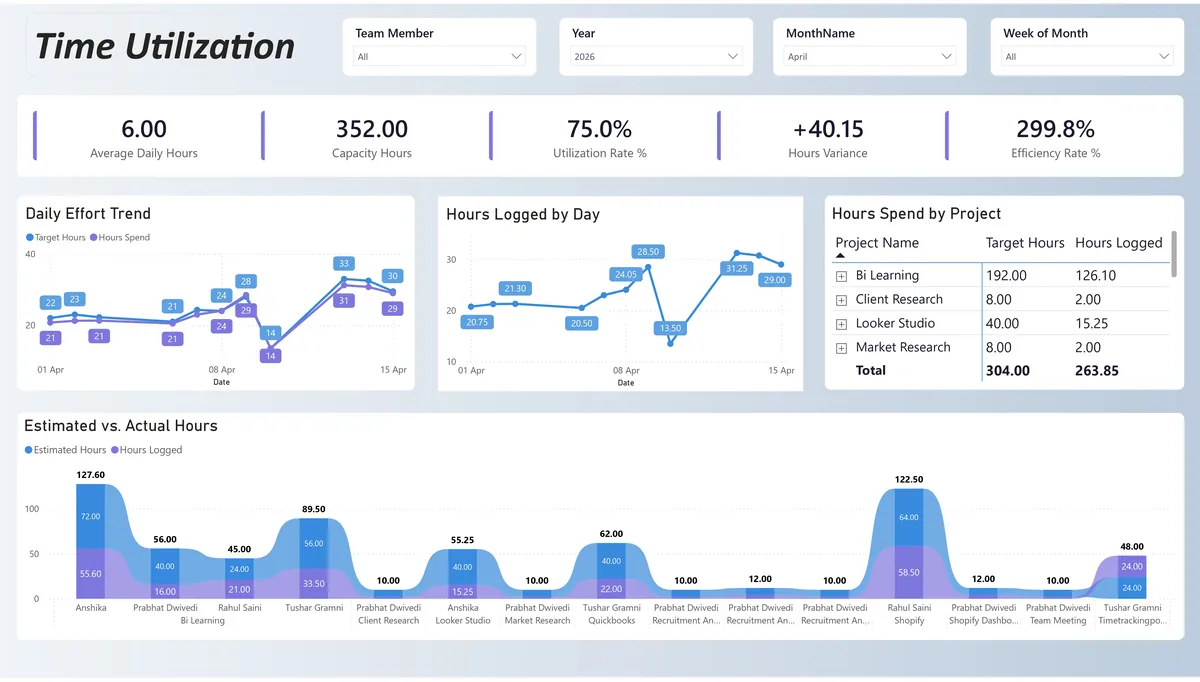
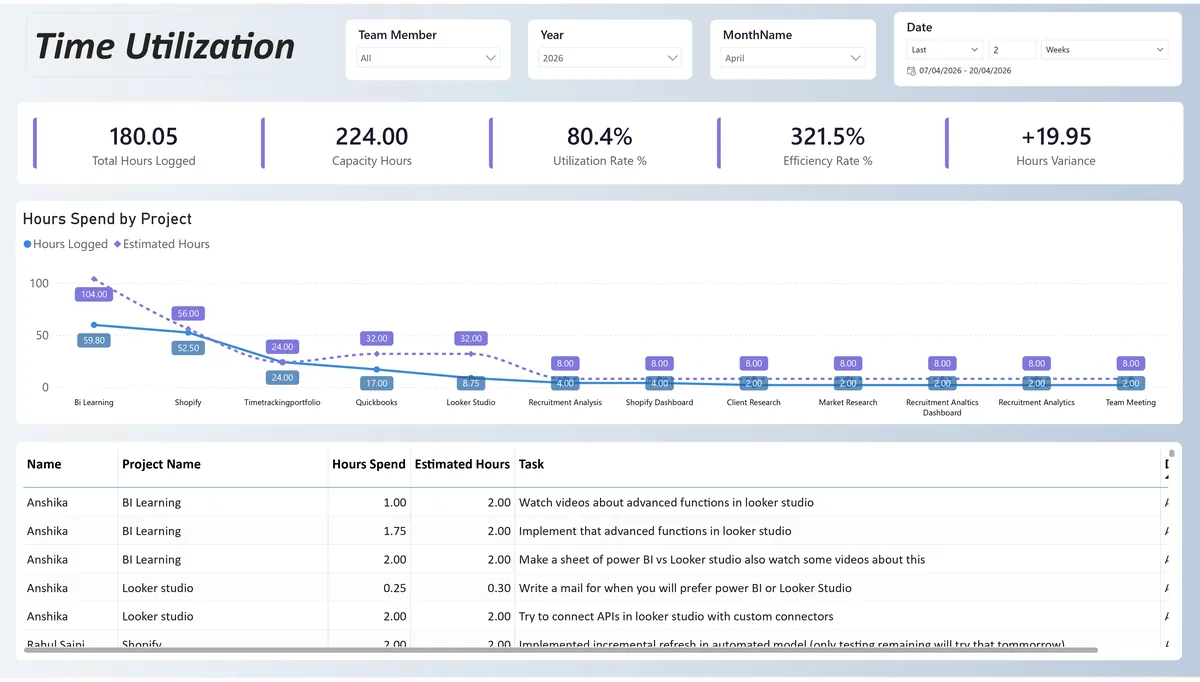
Time Utilisation Dashboard
The Challenge: A professional services firm had no visibility into how employee time was being allocated. Billable vs. non-billable hours were tracked manually, and project profitability was guesswork.
Our Approach: We integrated timesheet, project, and payroll data into a comprehensive Power BI solution tracking employee time allocation across projects, departments, and billable categories.
The Outcome: Management gained full visibility into workforce productivity. Billable utilisation increased by 22%, and project scoping accuracy improved dramatically.
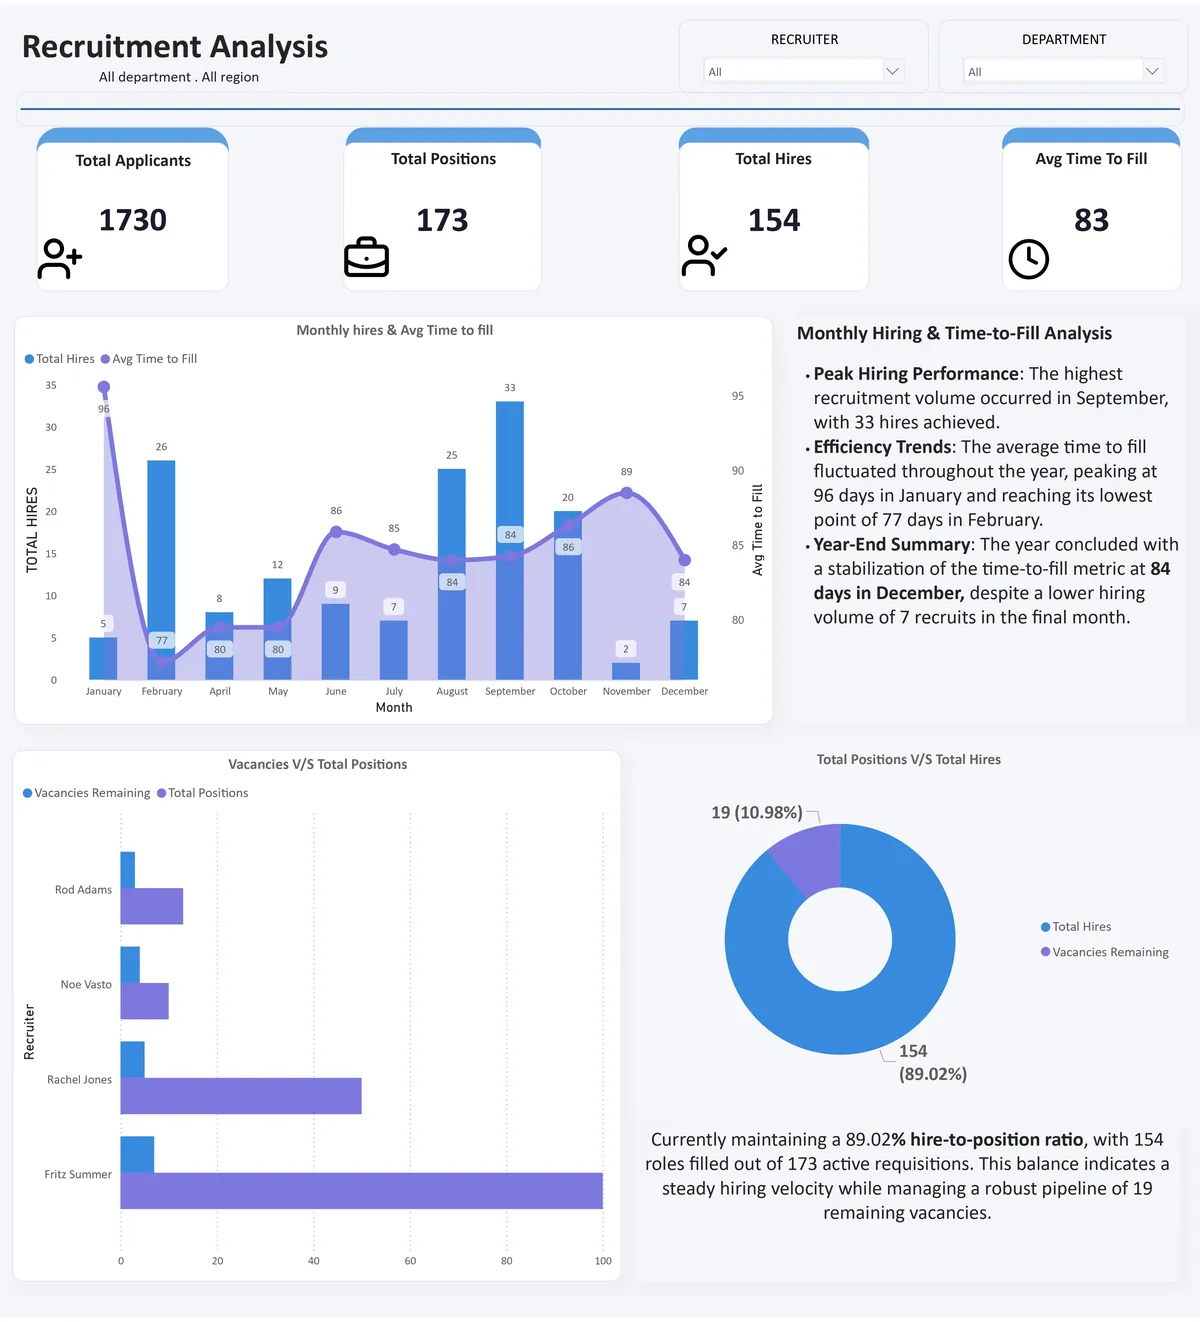
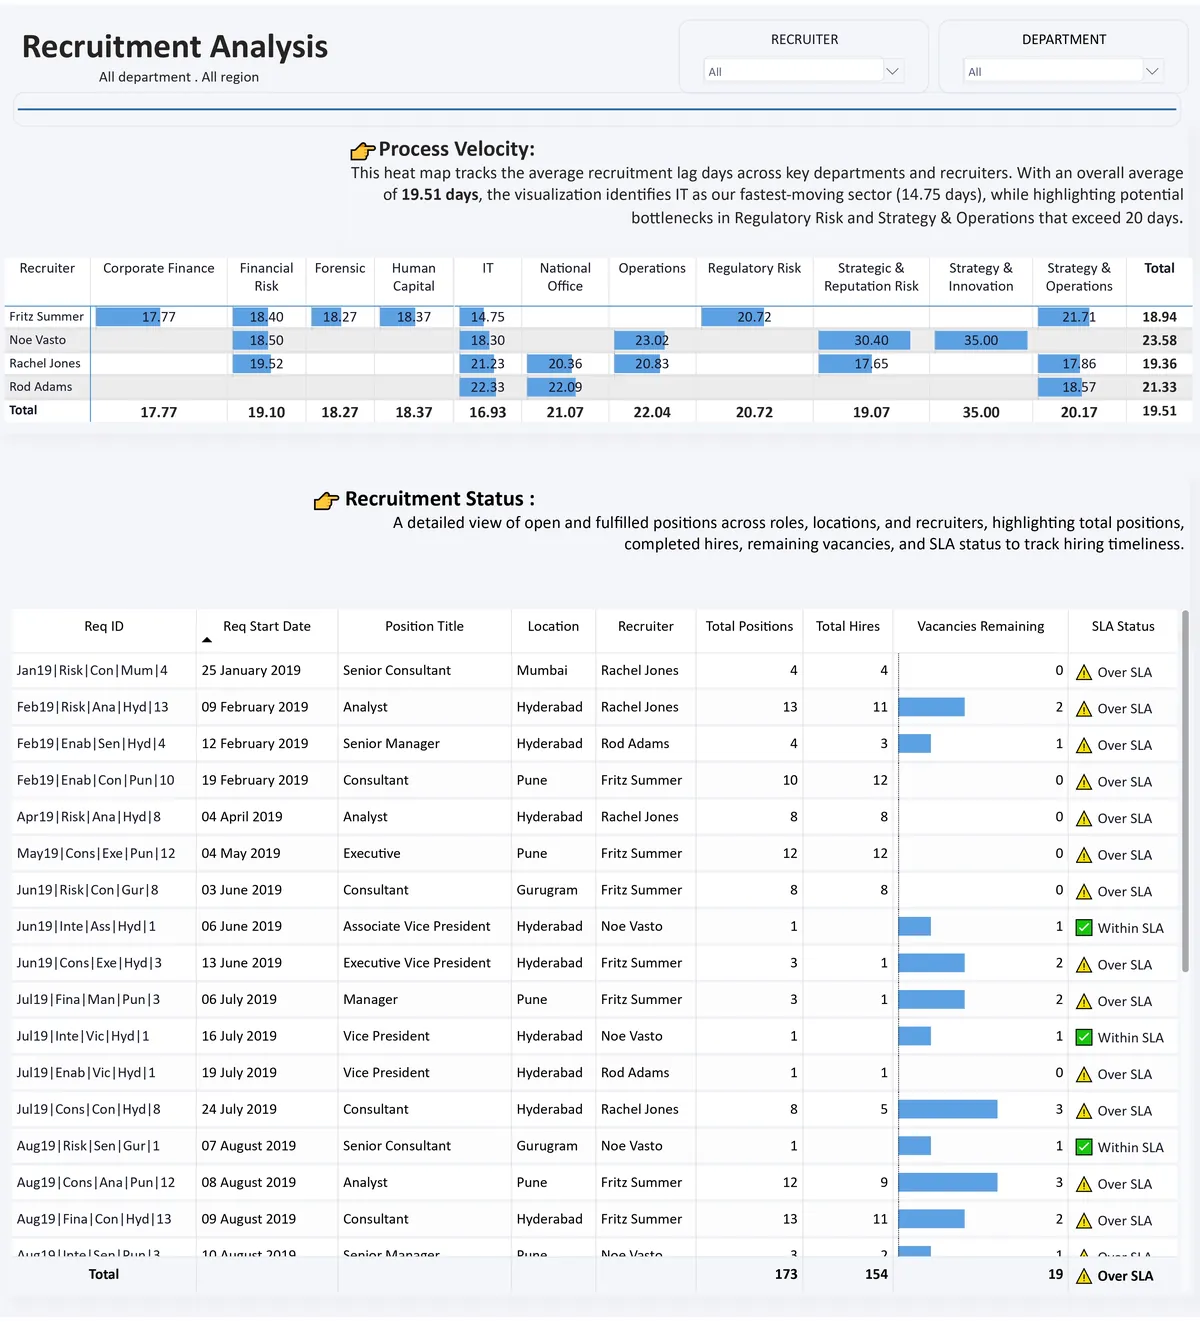
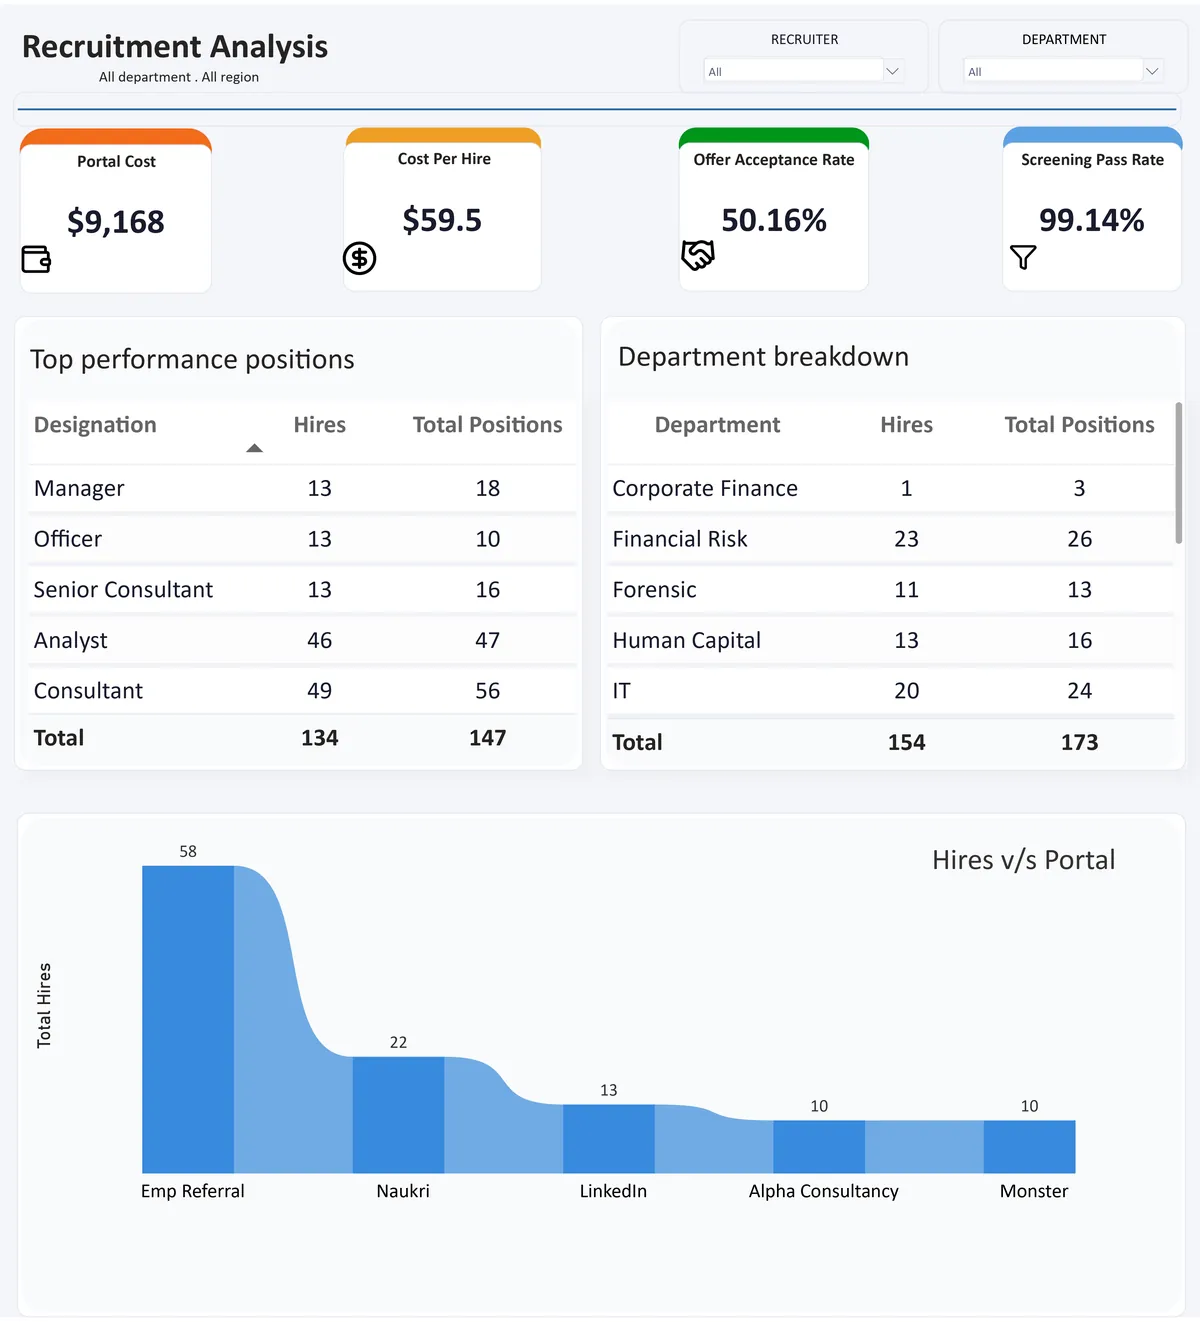
Recruitment Analysis
The Challenge: A growing company's HR team had no data-driven view of their recruitment pipeline. Time-to-hire was increasing, cost-per-hire was unknown, and the best sourcing channels were unclear.
Our Approach: We built end-to-end recruitment pipeline analytics covering time-to-hire, source effectiveness, conversion rates by stage, and cost-per-hire across departments and roles.
The Outcome: HR now makes data-driven hiring decisions. Time-to-hire dropped 28%, and the team reallocated budget from underperforming channels — saving £45K annually.
Want results like these?
Every business is different. Let's discuss what Accurism can do for yours.
Schedule a Consultation